What the investigations established
- Coursework scope
- Individual analysis across a semester of supplied FOR-440 network-forensics and threat-hunting scenarios.
- Analysis performed
- I configured and queried the analysis platforms, generated or replayed lab traffic, traced activity across network and endpoint sources, and wrote the investigation queries, scripts and controlled test signatures used in the exercises.
- Evidence sources
- Security Onion and Elastic
- Zeek and packet analysis
- Sysmon process chains
- Velociraptor hunts
- Snort rules
- YARA searches
- Results
- The investigations reconstructed a controlled DNS transfer, exposed a dashboard coverage gap in the supplied FTP scenario, linked file and SMTP evidence in Zeek, and traced supplied process chains into endpoint and network telemetry. The guided, mostly single-host scenarios did not establish production detection coverage.
FOR-440 was organised as nine supplied lab scenarios rather than one final case. Across the series, I moved between packet-level evidence, network-security monitoring, Windows process behaviour, endpoint telemetry, and detection logic.
I used the series to answer three recurring questions:
- What did the alert, protocol log, packet capture, or endpoint event actually show?
- Which identifier or timestamp connected that observation to another source?
- What remained unproven when one of those sources was absent or silent?
The environments, captures, scenarios, and suspicious binaries were supplied for coursework. My work was configuring the analysis platforms, generating or replaying the required traffic, answering the investigative questions, writing focused queries or test rules, and documenting both the observations and their limits.
The labs developed from Security Onion and packet analysis through discovery, clear-text authentication, DNS data transfer, and Zeek metadata. The later work moved onto Windows process baselining, Velociraptor hunts, Sysmon chains, privilege transitions, YARA, and controlled Snort signatures.
| Lab area | Investigation performed |
|---|---|
| Security Onion setup | Configured the platform, added an analyst user, opened evidence in NetworkMiner, and compared Kibana with Sguil |
| Discovery and FTP | Traced ARP discovery, DNS follow-up, clear-text credentials, a supplied vulnerable FTP service, and a dashboard detection gap |
| DNS data transfer | Reconstructed encoded test data from DNS labels and hunted the same traffic in Elastic |
| Zeek | Correlated connection, protocol, file, and PE metadata to investigate executable transfers and a leaked document |
| Windows processes | Built a baseline for parentage, services, loaded DLLs, and disk-versus-memory strings |
| Velociraptor | Deployed a server and endpoint client and hunted for Sysinternals execution through Prefetch |
| Sysmon and YARA | Followed supplied process chains through file, registry, DNS, and network events and tested a focused rule with an explicit self-match limitation |
| Privilege transitions | Used process creation and integrity levels to reconstruct a supplied UAC-bypass scenario |
| Snort | Reviewed configuration, packet logging, preprocessors, rule loading, and controlled custom-rule tests |
Three investigations carried the main argument of the series. In the FTP exercise, packet collection preserved activity that the dashboard did not promote into an alert. In the DNS exercise, the captured labels could be transformed back into the controlled source file. In the Sysmon exercise, endpoint domains and timestamps became pivots into network logs, including cases where the sources did not agree.
| Case | Evidence chain and boundary |
|---|---|
| FTP visibility gap | Observation: a later command channel crossed TCP port 6200 while the visible dashboard remained quiet. Correlation: TShark and tcpdump packet evidence were compared with Sguil and Kibana. Supports: collection at the monitored interface succeeded, but the supplied alerting path did not surface the activity consistently. Remaining gap: I did not isolate whether the failure sat in parsing, rule coverage or configuration. |
| Controlled DNS transfer | Observation: repeated queries carried long hexadecimal labels under one supplied lab domain. Correlation: packet extraction, successful reconstruction of the controlled file and an Elastic hunt for the generating host. Supports: the complete lab transformation path was reproduced rather than inferred from an unusual domain alone. Remaining gap: the conspicuous test did not measure performance against normal enterprise noise or encrypted DNS. |
| Endpoint-to-network pivot | Observation: a supplied process chain created files, child processes, DNS queries and outbound connections. Correlation: Sysmon and Process Monitor events were pivoted by domain and time into Zeek, Sguil and Kibana. Supports: endpoint and network evidence described different parts of the same execution timeline. Remaining gap: missing network observations could not be separated conclusively into execution, capture, timing, parsing or configuration differences. |
Establishing the evidence layers
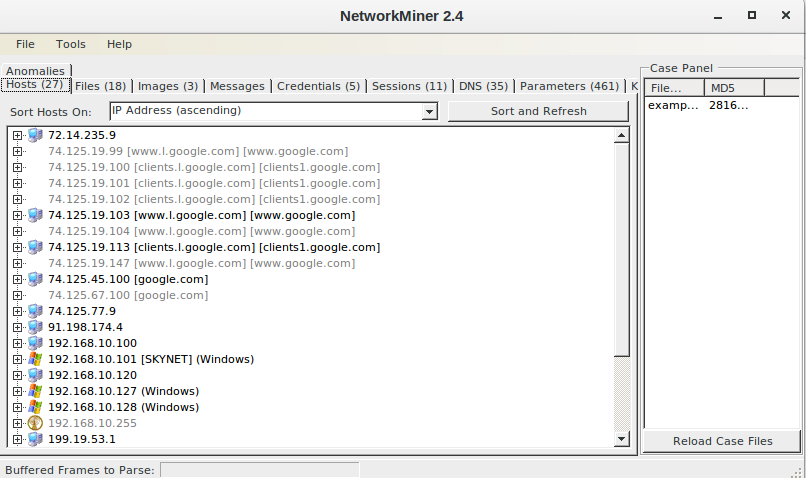
The first labs established a Security Onion environment and its main analysis surfaces. I configured the monitoring system, added an analyst account, opened packet captures in NetworkMiner, and compared the views available through Kibana and Sguil.
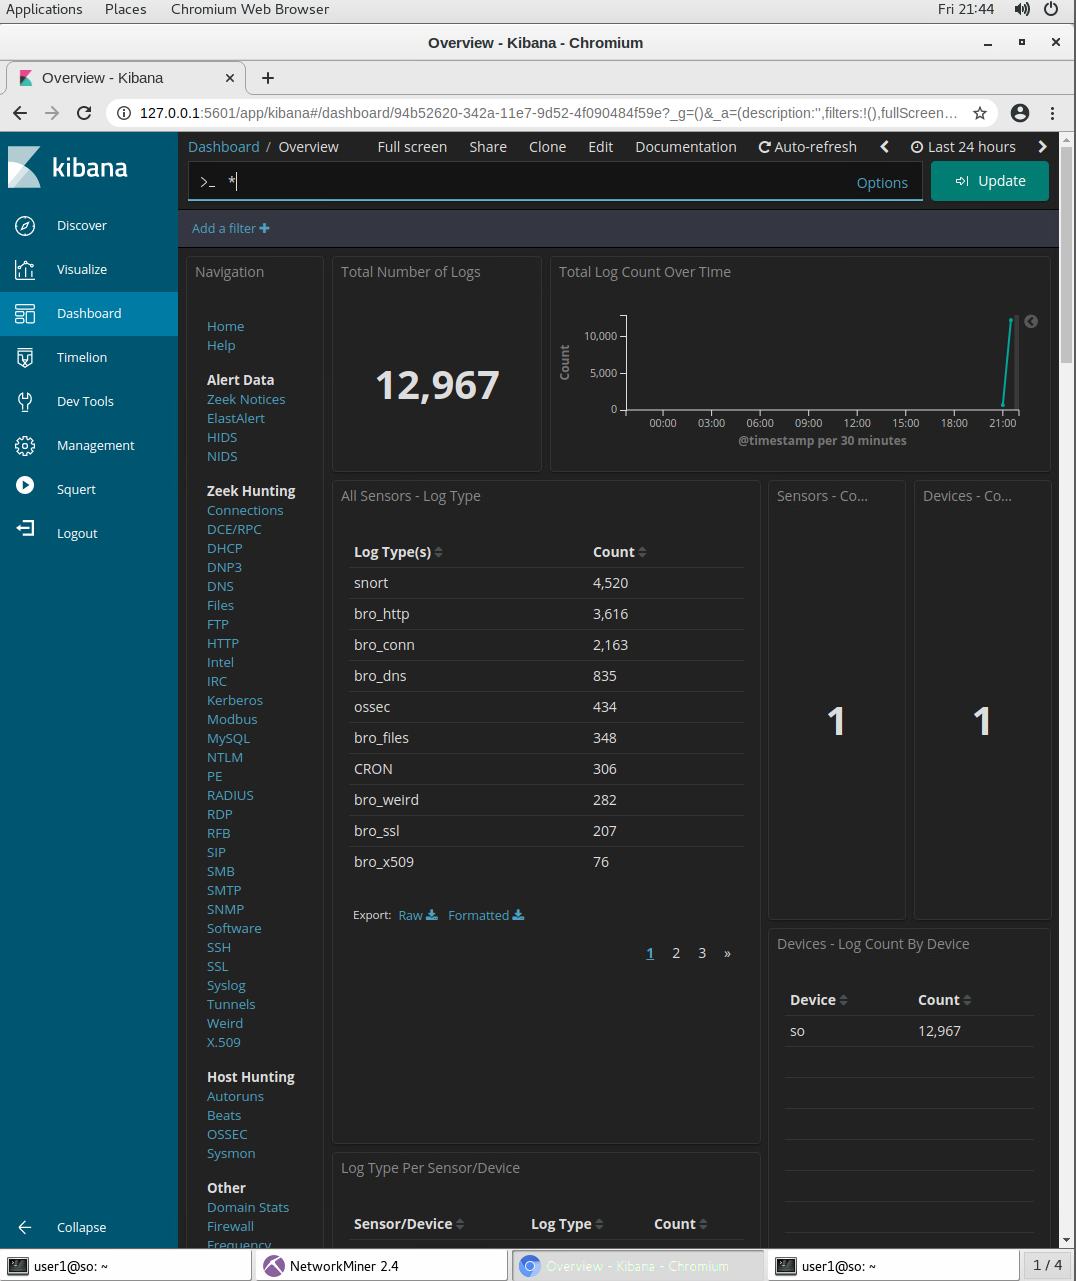
Kibana gave me indexed, searchable protocol and event data, including dedicated DNS, SSH, HTTP, and TLS views. Sguil presented real-time network-security alerts and made it easier to pivot into the associated sessions. NetworkMiner reconstructed hosts, files, and application activity from packet captures. The same traffic looked different in each interface, so I started using them as complementary views rather than expecting one dashboard to answer every question.
One early hunt looked for downloads that did not fit ordinary web browsing. Filtering HTTP activity by MIME type exposed archive or executable transfers that would be easy to miss among normal HTML requests. The exercise introduced a recurring pattern for the module:
- establish what normal activity looks like
- identify a property that separates the suspect behaviour
- narrow the event set
- return to the underlying packets before making a conclusion
The HTTP hunt separated normal text/html responses from archive and executable MIME types. It was a simple query, but it demonstrated how an allow-listing question can become an observable feature: which hosts were receiving software-like content, from where, and whether that transfer was expected.
Case 1: when captured traffic did not become an alert
A network-discovery exercise showed how an active scan appeared from the monitoring side. A supplied /24 lab range contained 256 addresses, of which 31 answered the ARP discovery pass. The local scan generated a burst of ARP requests, followed by DNS lookups as the scanner attempted to resolve responding addresses. Packet data exposed the scanning host’s layer-two identity, the range queried, and the systems that replied. The observed MAC prefix mapped to VMware, adding platform context without identifying a particular physical device.
The next part used a deliberately vulnerable vsftpd 2.3.4 service. Because classic FTP sends credentials in clear text, packet inspection revealed repeated username and password attempts. I used TShark, NetworkMiner, Sguil, and Kibana to compare what the raw capture contained with what the monitoring platform surfaced as alerts.
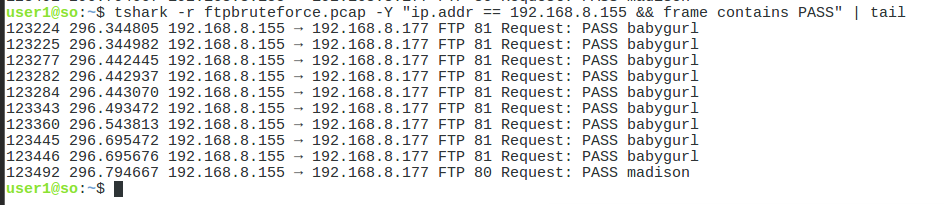
PASS commands. These values belonged only to the isolated teaching environment, which was destroyed four years before publication; they cannot authenticate to a live or reused system.TShark filters isolated the USER and PASS commands. NetworkMiner provided an application-oriented view of the same session. Sguil raised possible brute-force alerts for two prominent account names, with 39 and 38 matching events respectively, while manual counting showed that most names had been attempted at a similar volume. The difference demonstrated why an alert count should be checked against the capture before it is treated as a complete account of the activity.
Packet review then exposed a stronger coverage gap in the supplied configuration. The FTP scenario opened a separate TCP service after the initial interaction, and the later commands crossed port 6200 rather than the normal FTP control port 21.
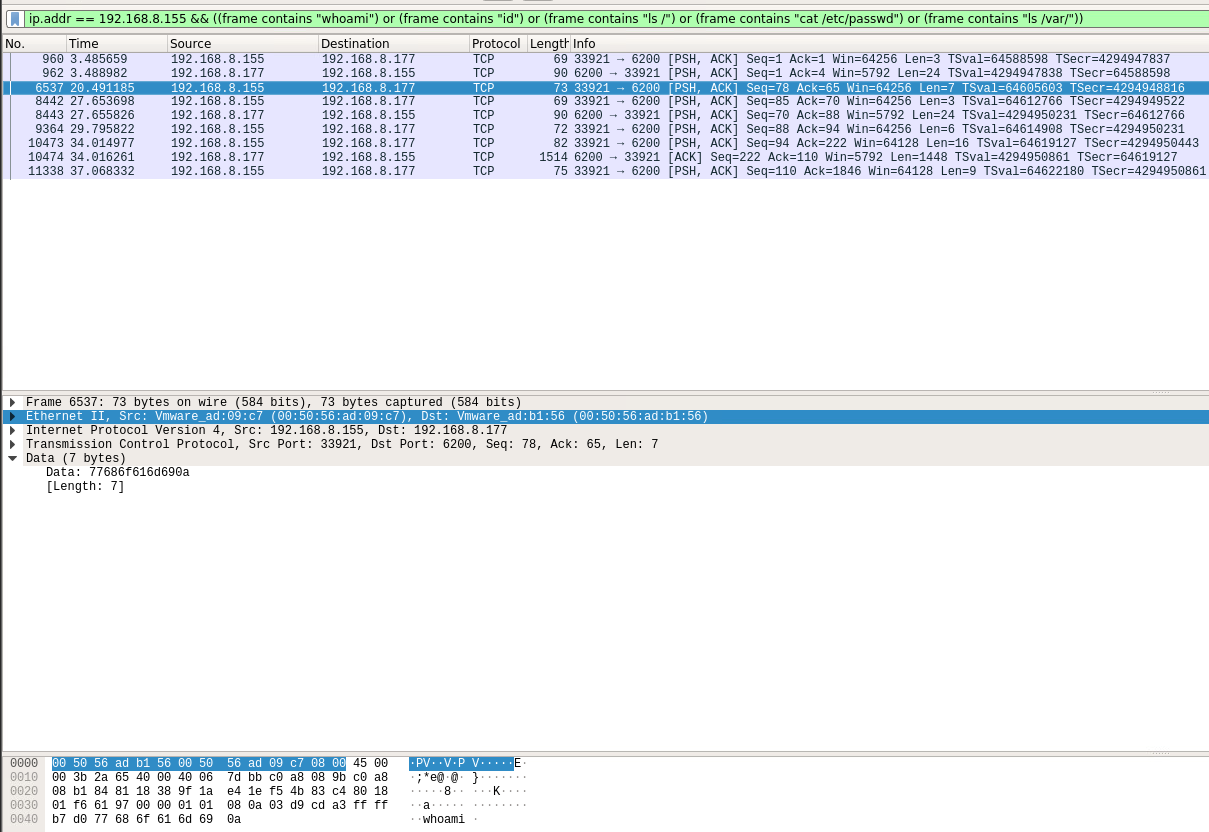
Repeating the activity still did not produce a corresponding dashboard detection even though tcpdump on the monitored interface captured the packets. The FTP dashboard remained at zero while Sguil displayed other scan and FTP alerts from the exercise. That combination narrowed the problem to parsing, rule coverage or dashboard configuration rather than collection at the interface.
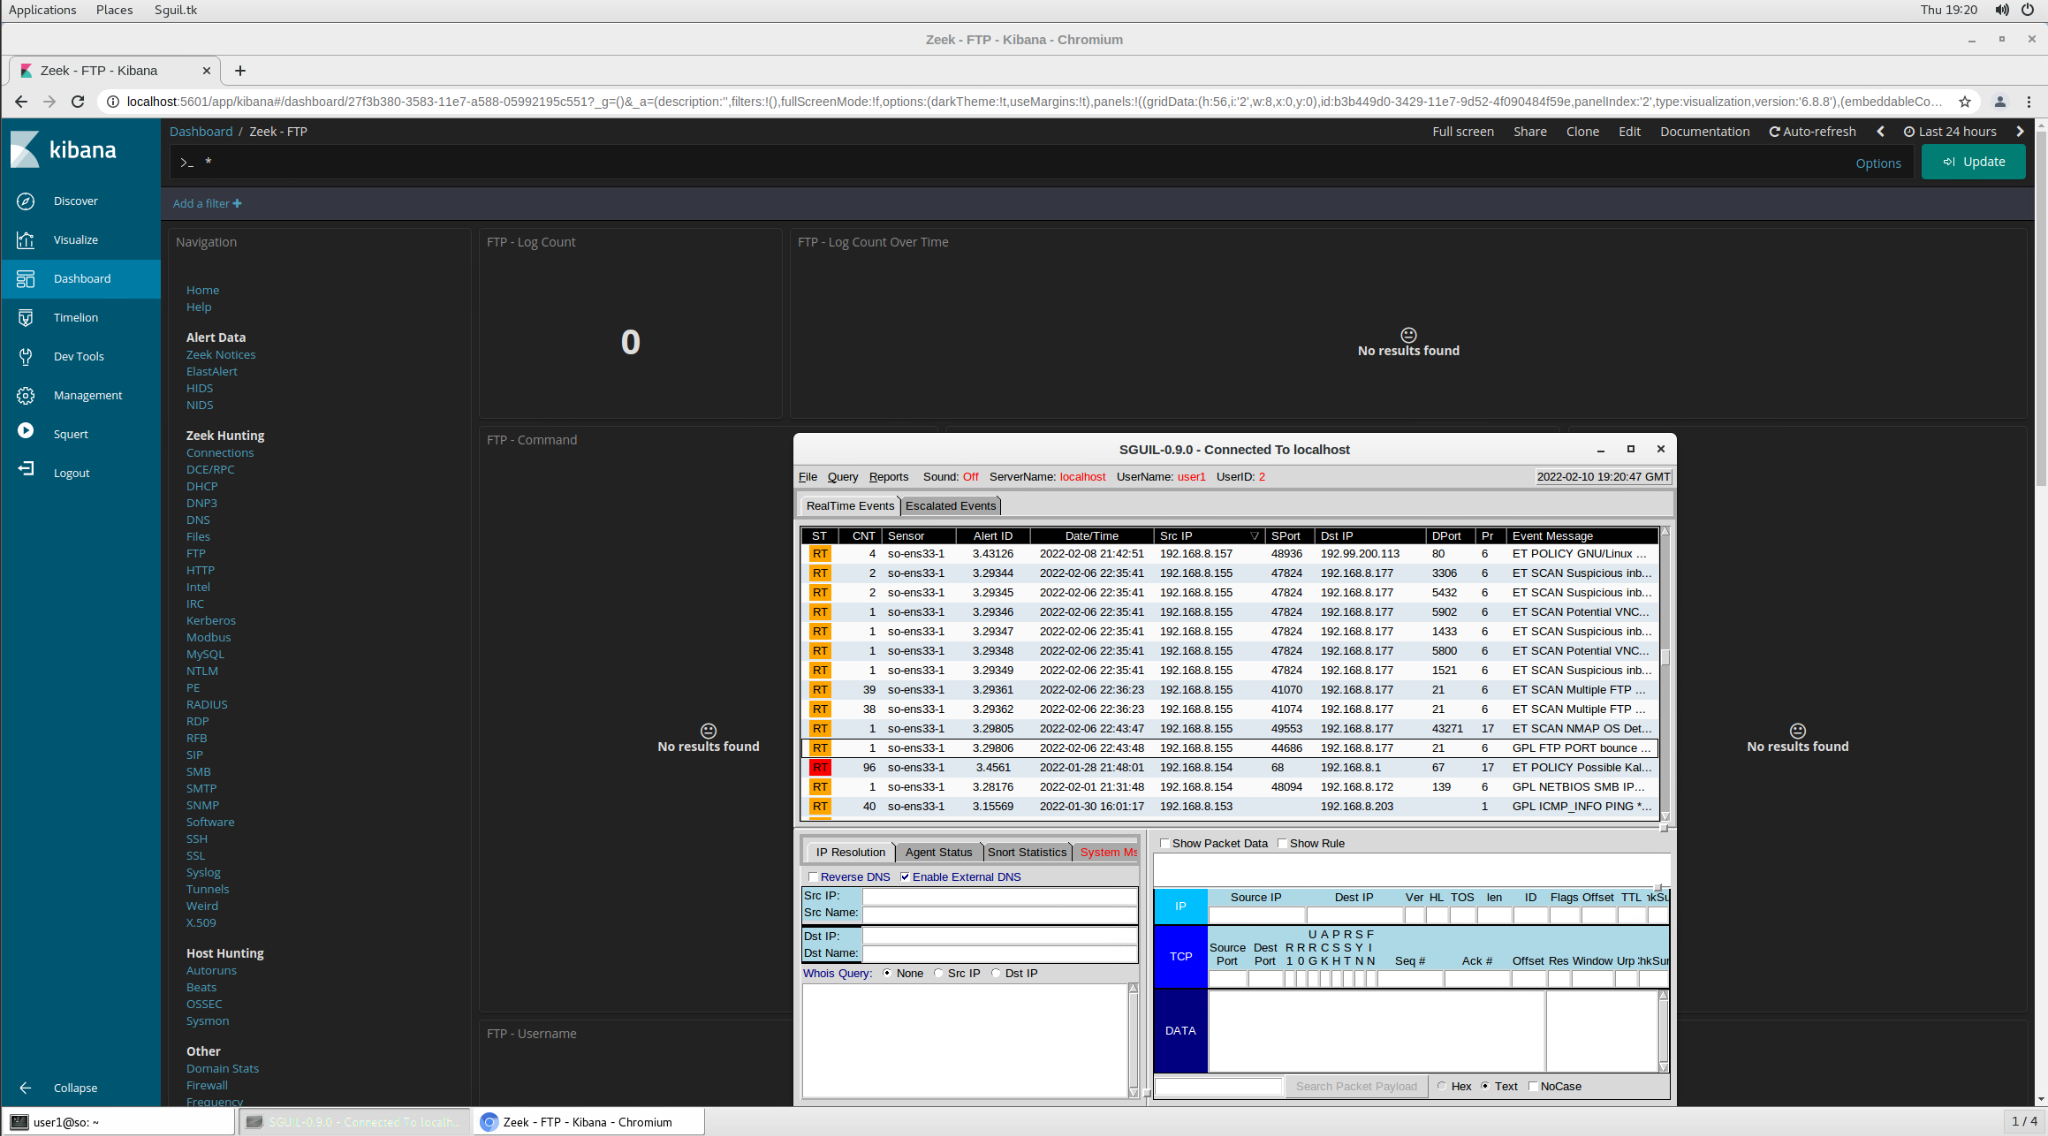
This was my first practical example of the difference between visibility and detection. Capturing an event does not guarantee that a rule identifies it, and an empty alert panel does not prove that nothing happened.
Case 2: reconstructing a controlled DNS transfer
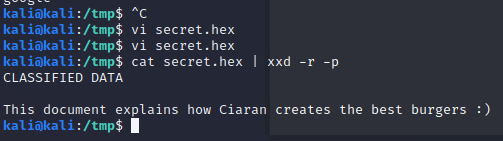
Another exercise encoded a test file and carried the resulting data through DNS queries. I captured the queries on the generating side, reconstructed the content from the packet data, and then approached the same activity as a threat hunter in Security Onion.
The controlled file was converted to hexadecimal and split across the left-most labels of repeated queries to one lab domain. On the capture side, I extracted the query-name field, isolated those labels, removed repeated values, joined the hexadecimal text, and converted it back into the original file. This proved the complete transformation path rather than identifying only a suspicious domain.
The hunt concentrated on the shape of the DNS requests rather than the contents of the original file. The suspicious host produced query labels that differed from ordinary lookups in length, repetition, and encoded appearance. Filtering DNS events by the generating host made the sequence visible in Kibana.
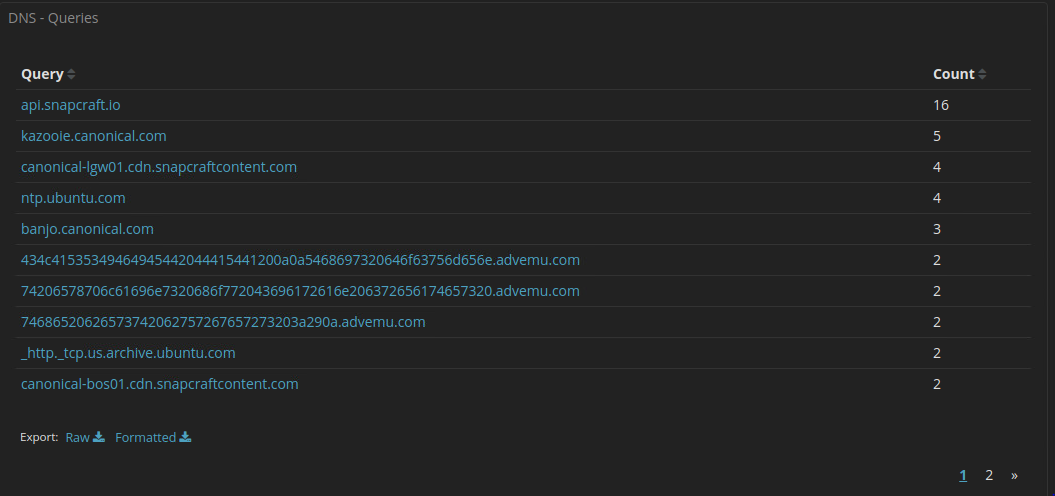
advemu.com lab domain alongside ordinary Ubuntu and Snapcraft lookups. The domain belonged to the isolated teaching environment and no longer exists.The lab showed why DNS deserves more than availability monitoring. It is a normal, high-volume protocol that nearly every host needs, which also makes it an attractive channel for covert transfer. Useful detection features include unusual label length, entropy, volume, repeated requests to one parent domain, uncommon record types, and a host’s deviation from its normal query pattern.
The lab data was deliberately simple: hexadecimal has a restricted character set and doubles the original byte length, and every line used the same parent domain. Those properties made the controlled transfer conspicuous and repeatable; they did not establish how the same hunt would perform against noisier or encrypted DNS traffic.
Zeek logs and cross-protocol correlation
Zeek changed the way I worked with packet captures. Instead of starting every question from individual frames, I could use structured logs for connections, DNS, DHCP, SMTP, files, and Portable Executable metadata.
Running Zeek over the supplied capture created eight relevant logs:
conn.logfor connection summariessmtp.log,dhcp.log, anddns.logfor protocol metadatafiles.logfor observed file transferspe.logfor Portable Executable attributesweird.logfor protocol anomaliespacket_filter.logfor the filter applied during processing
The headers also became part of the analysis. #separator defined the tab-delimited format, #empty_field and #unset_field distinguished absent values, and the #fields and #types rows described each column. In conn.log, ts recorded time, uid provided a connection identifier, and id.orig_h, id.orig_p, id.resp_h, and id.resp_p described the two endpoints. I could add fields such as duration without abandoning the structured format.
One DHCP question linked the server, assigned address, and a lease value of 1800. That was a compact example of why protocol logs are easier to query than repeatedly locating the transaction in packet frames.
I learnt how Zeek’s uid and file identifiers connect records across log types. A connection in conn.log could be associated with an HTTP or SMTP transaction, then followed into files.log, and finally matched with pe.log if the transferred object was a Windows executable.
That workflow supported questions such as:
- which host transmitted and received a file
- which protocol carried it
- what MIME type Zeek identified
- whether the object could be extracted
- which Portable Executable protections were present
- whether external reputation data agreed with the local evidence
The executable exercise included checking mitigations such as ASLR, DEP, structured exception handling, and stack protection. Missing mitigations were not treated as proof of malware, but they added context when combined with the file’s structure, transfer path, and external classification.
In the supplied evidence, document.exe appeared in files.log. Its file identifier matched the corresponding pe.log entry. The recorded PE metadata showed structured exception handling but not ASLR, DEP, or stack-canary protection, and the usual section information was incomplete. I extracted the transferred object and checked its hash against external reputation data, which classified it as malware. Related .scr and .bat files with the same base name were also recovered and classified.
Reconstructing the leaked document
The Zeek exercise also contained an SMTP document leak. I used files.log to identify application-layer protocols and MIME types, then followed the file identifier into the extraction directory. The target file was advice.pdf, marked as confidential in its contents.
The same connection identifier linked the PDF back to smtp.log, which recorded the sender and recipient addresses from the supplied scenario and the subject [Confidential] Advice. conn.log associated the message with its originating lab host, while the Evolution mail client appeared in software.log.
This investigation moved through several records:
files.log
    -> identify PDF and file identifier
    -> recover and inspect extracted object
    -> match connection UID in smtp.log
    -> recover sender, recipient, subject, and message context
    -> match UID in conn.log for source host
    -> check software.log for client identification
I also generated unique lists of SMTP participants and source and destination hosts by normalising comma-separated address fields, joining sender and recipient results, sorting them, and removing duplicates. That moved the work from one suspicious message to a view of the wider communication set.
Zeek also made the limits of automatic parsing visible. Capture filters, snap length, protocol recognition, encryption, malformed traffic, and missing packets all affect what appears in the logs. I kept the original packet capture available so structured output could be checked against the source.
Learning normal Windows process behaviour
The endpoint section began with normal Windows processes. I recorded process IDs, parent IDs, executable paths, user context, and loaded DLLs for applications launched in different ways.
For example, userinit.exe launched explorer.exe during interactive logon and then terminated. A command shell opened from Explorer had explorer.exe as its parent, while a second cmd.exe launched from inside that shell inherited the first command shell as its parent. Those relationships provide a baseline for interpreting unusual ancestry later.
I also compared on-disk strings with strings found in process memory. Text entered into a running application was visible in its memory even when it did not appear in a simple scan of the executable. That connected directly to malware that decrypts configuration or code only after launch: disk scanning and memory inspection answer different questions.
Reviewing Windows services and DLL loading added more context. I compared svchost.exe instances with their -k service groups, user context, session, registry configuration, and hosted DLLs. Multiple instances were legitimate because Windows separated service groups such as DCOM launch, RPC, local service, network service, and netsvcs.
Two Notepad processes launched through different parents loaded the same DLL set at matching image bases. ntdll.dll also appeared at the same base in Explorer. Shared image sections and system-wide address choices explained that observation; it was not evidence that the processes were one execution.
The baseline then made two supplied binaries easier to interpret:
NotTooEvil.execreated child command shells, downloaded an archive into the temporary directory, transformed a copy into another file, contacted a public test address, and removed itself.BewareMe.bincreated a child namedsvchost.exefrom a user-profile roaming path rather thanC:\Windows\System32; external classification identified it as an Adramax keylogger sample.
The filename alone was weak evidence. Parentage, full path, command line, created files, and network activity formed the useful profile.
Endpoint hunting with Velociraptor
I deployed a Velociraptor server and client, then used the interface to run a hunt for evidence of Sysinternals tool execution. Prefetch collection provided execution history and helped identify where the tools had been launched from.
The workflow separated deployment from collection. I first confirmed that the endpoint checked into the server, then defined the hunt, reviewed returned rows, and acquired the Prefetch artefacts needed to establish executable name, prior execution, and source location. That was more targeted than collecting an entire disk image simply to answer whether a known tool had run.
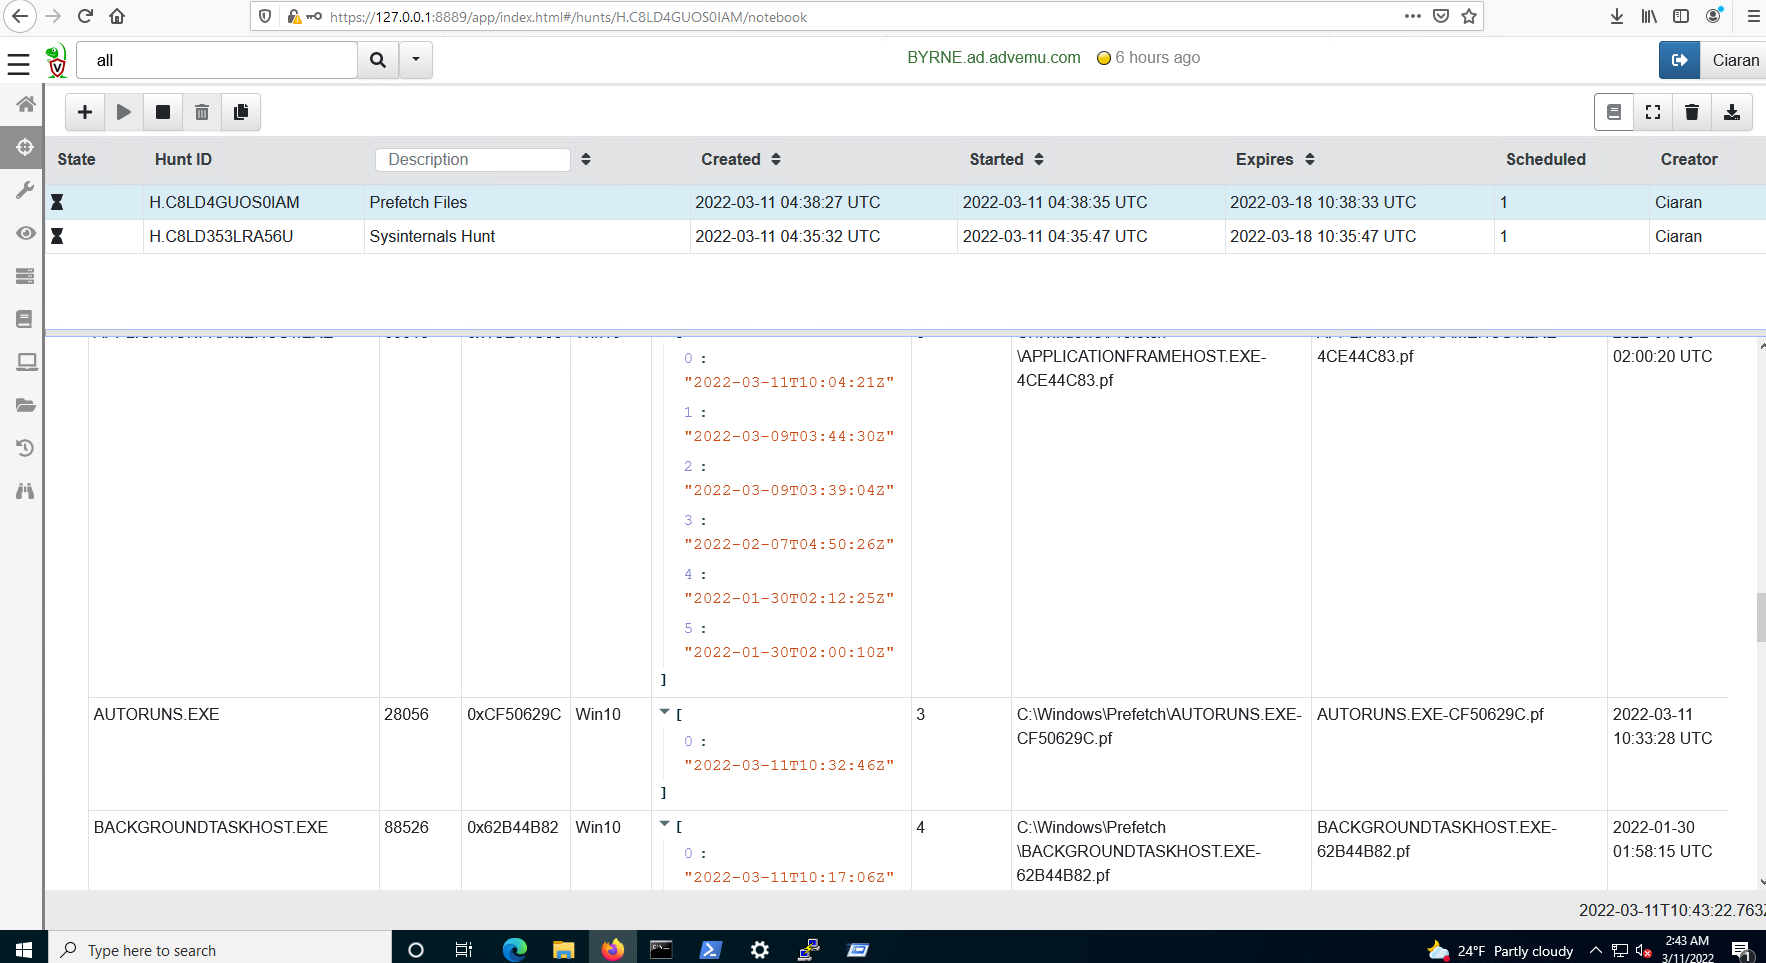
AUTORUNS.EXE Prefetch record with its path and prior run times.The exercise showed how a defined artefact query can answer a scoping question without collecting an entire disk image from the lab endpoint.
Case 3: correlating a process chain with network evidence
Sysmon supplied the most detailed endpoint timeline in the module. I first compared normal and elevated command-shell launches, using integrity levels and parent-child relationships to see the extra processes involved when User Account Control was invoked.
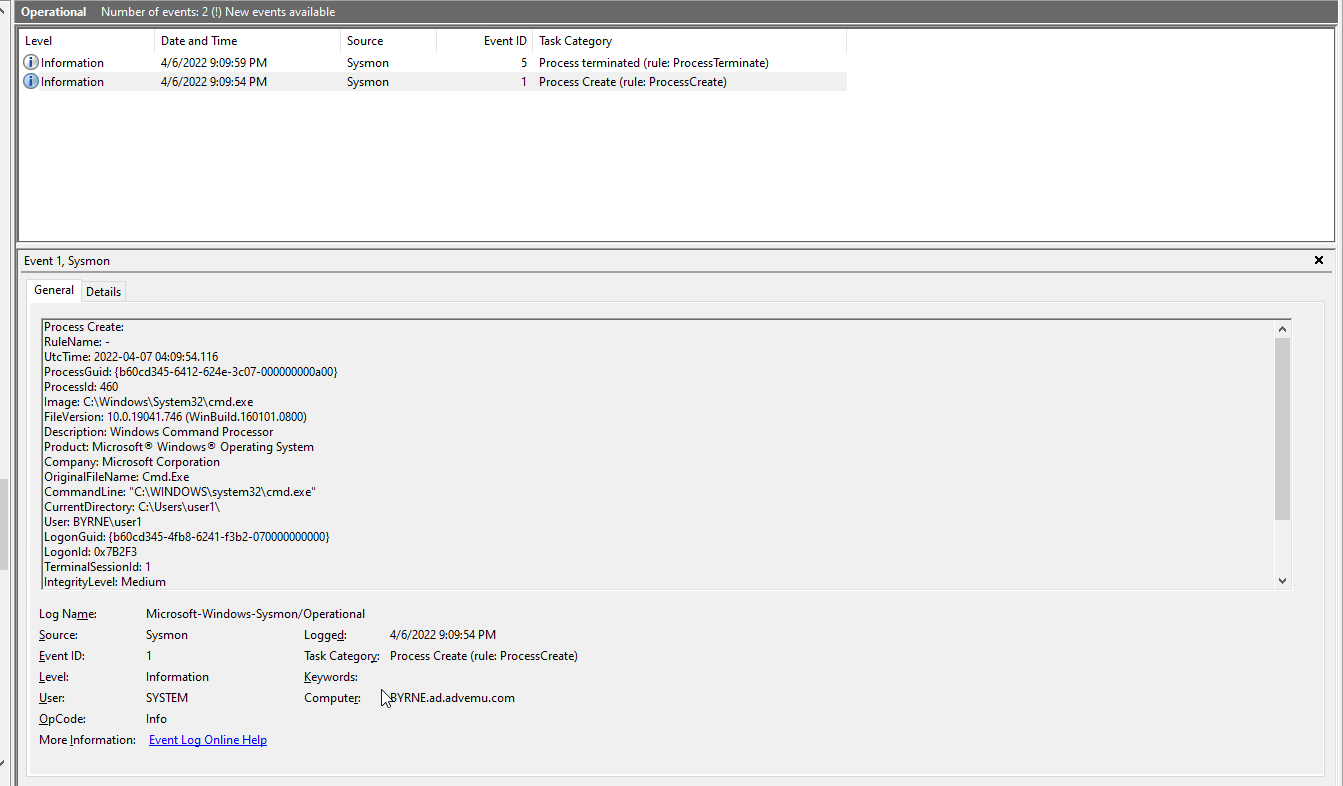
Later supplied samples produced longer chains involving:
- an initial executable
- files written to a user-accessible directory
- child-process creation
- service activity
- registry changes
- DNS lookups
- outbound network connections
- transitions to higher integrity
I traced those chains through process-creation events rather than searching only for a filename. Parent process, command line, image path, hashes, integrity level, user, and timestamp made it possible to follow one stage into the next.
One supplied chain began with BewareMe2.exe, which wrote and launched BewareMe2Srv.exe. That process created DesktopLayer.exe under a user-profile path, launched it, and terminated. DesktopLayer.exe then started a browser-named process. Sysmon and Process Monitor exposed the file writes, parent-child transitions, command-line values, registry modification, DNS queries, and outbound connections.
The later endpoint exercises used two supplied executables. Static inspection identified BewareMe2.exe as a 204,800-byte 32-bit Windows GUI executable and bypassuac.exe as a 201,728-byte 32-bit Windows console executable. Their SHA-256 digests are 4e972f2ca31130db42eca704fb9041eb87da88d59cd8620f222b7e513dd4310e and c1bc024dd7822f801074d2a35e1a1b598f6b1fcab0059c883e75f6e56ceb8d8f. I have not rerun those untrusted binaries; the runtime findings below come from the telemetry I captured during the controlled exercises.
The network review then used the Sysmon DNS names as pivots into Zeek:
- extract DNS observations from endpoint events
- locate those names in
dns.log - collect the resolved addresses
- search
conn.log,http.log, andfiles.log - compare the network result with the process timeline
One HTTP response contained Base64 text that decoded to an error-like byte-array message. Other expected destinations reported by the external sandbox were absent from Zeek, Sguil, and Kibana. I recorded that as a collection or execution difference, not evidence that the endpoint event was wrong.
The endpoint and network views did not always agree immediately. Sysmon recorded process and DNS activity that was difficult to find in the Zeek or Security Onion views, while packet data supplied network context that a process event did not contain. Correlating timestamps and domains across both sources produced a stronger account than either source alone.
My YARA rule combined exact hashes, selected imports, and deliberately misspelt API-like strings observed in the supplied sample. The recursive test matched both the sample archive and the rule text containing those strings. That self-match was a useful negative result: the rule needed a more carefully scoped target and independent benign and malicious test sets before it could support reliable detection.
Integrity levels and privilege transitions
Before examining the supplied privilege-escalation sequence, I compared normal and elevated command-shell launches. The medium-integrity shell produced its ordinary process event, while the elevated launch added consent.exe for User Account Control and created a high-integrity child. That gave me a known baseline for elevation.
In the later exercise, six process events formed the relevant chain. The supplied binary invoked consent.exe, a higher-integrity command shell launched another instance of the binary, a temporary service was created, a 32-bit command shell wrote to a named pipe, and the final command shell ran at System integrity.
I did not need to understand every internal instruction of the supplied binary to reconstruct the observable transition. Process GUIDs, parent process GUIDs, image paths, command lines, service creation, timestamp order, and integrity levels showed where the security context changed.
Snort and the limits of a signature
The Snort labs covered packet display, logging, network variables, preprocessors, rule paths, and custom alerts. In one supplied capture, Snort counted 1,309 TCP packets, 74 UDP packets, no ICMP packets, 1,383 IPv4 packets, and 1,384 packets overall. It organised logged traffic into address-based directories with separate ASCII records for TCP and UDP sessions.
I reviewed how HOME_NET and EXTERNAL_NET defined the protected and untrusted sides, how IP and port variables were reused by rules, where local rules were loaded, and how checksum, stream, and HTTP preprocessors affected inspection. The Security Onion instance loaded 24,505 rules for the exercise.
I then wrote simple rules for protocol flags and content in supplied traffic and generated matching test packets to verify that the rules fired. One rule detected a FIN/ACK combination; another matched a known text marker in an ICMP payload. These were controlled tests of rule syntax and verification, not proposed production detections.
The mechanics were straightforward; choosing a useful condition was harder. A highly specific content rule can recognise the exact sample it was written for while missing a slightly changed variant. A broad rule may identify more activity but produce too much noise.
The exercise made several rule-quality questions explicit:
- Is the header direction correct for the traffic being detected?
- Are source and destination variables scoped to the monitored environment?
- Does the rule inspect the correct protocol layer?
- Is the content value stable enough to be useful?
- What benign traffic could satisfy the same condition?
- Does the packet need reassembly or normalisation before matching?
- Can a known test packet trigger the alert reliably?
- Does the alert retain enough context for an analyst to investigate?
Snort therefore became another layer in the investigation workflow:
- the rule provides a starting signal
- session and packet data show what actually crossed the network
- Zeek adds structured context
- endpoint telemetry identifies the responsible process and user
- forensic artefacts show what remained afterwards
A correlation workflow
The course linked tools that are often taught separately. Packet capture, network metadata, endpoint events, process inspection, and forensic artefacts all described different parts of the same activity.
By the end of the labs, my workflow had become more disciplined:
- define the question before opening a dashboard
- establish the host, user, and time range
- inspect the alert but retain access to the underlying evidence
- pivot through stable identifiers such as Zeek UIDs, file IDs, process IDs, hashes, and timestamps
- compare network and endpoint observations
- document what is confirmed, what is inferred, and what collection is still missing
The later Network Forensics Investigation applies that correlation discipline to one evidence-preservation and reconstruction case, while the Windows Endpoint Forensics Investigation develops the endpoint side through disk artefacts and collaborative incident reconstruction.
Limits and current relevance
These were guided lab exercises using supplied scenarios, captures, and binaries, usually against one endpoint or a small teaching network. They did not measure production false-positive rates or detection coverage. The DNS transfer was deliberately conspicuous, the Velociraptor hunt was narrowly scoped, and the YARA and Snort rules were tested against defined samples or packets rather than representative benign and malicious corpora.
I observed the supplied binaries through telemetry rather than completing a full reverse engineering of them. Where Sysmon, Zeek, Sguil, Kibana, and an external sandbox disagreed, I could not always distinguish an execution difference from a capture, timing, parsing, or configuration gap. The interfaces and rule sets reflect a 2022 teaching environment, so this page documents the investigative reasoning rather than a current deployment baseline.