
At a glance
- Authorised scope
- Three-person SYS-255 coursework built on six Ubuntu Server 18.04 virtual machines connected through a private VMware NAT network.
- My contribution
- Within a three-person project, I configured and validated the VM networking, four-node K3s cluster, Rancher import, deployed workloads, Elastic and Beats services, Logstash and Nginx configuration.
- Technical focus
- K3s cluster formation
- Rancher management
- Workload exposure and state
- Elastic data collection
- Layered validation
- Demonstrated outcome
- Rancher recorded the four-node K3s cluster as active, browser tests reached three deployed workload patterns, and Kibana displayed populated Filebeat and Metricbeat indices. Storage survival, Logstash transit and the Nginx authentication path were configured but not validated end to end.
From orchestration to observable services
In this 2021 SYS-255 team project, I connected a four-node K3s cluster to separate Rancher and Elastic hosts. The objective was to bring together two systems-administration problems: running containerised services across several small hosts and collecting enough operational data on another machine to inspect the environment.
This was a three-person project. My contribution covered the technical build and validation: VM addressing, K3s formation, Rancher management, workload deployment, Elastic collection, Logstash and Nginx configuration, and the checks described below.
The final environment used six Ubuntu Server 18.04 virtual machines in VMware Workstation 16. Each VM had two logical processors, 2 GB of RAM and 20 GB of storage:
| Role | VMs | Purpose |
|---|---|---|
| K3s server | 1 | Control-plane services and cluster administration |
| K3s agent | 3 | Worker capacity for scheduled workloads |
| Rancher host | 1 | Separate web management plane |
| Elastic host | 1 | Elasticsearch, Kibana, Logstash, Beats and Nginx |
The VMs used addresses from 192.168.33.200 through 192.168.33.205 on the now-retired 192.168.33.0/24 VMware NAT network. Netplan supplied static addressing, and /etc/hosts entries gave the cluster nodes predictable local name resolution.
We initially proposed placing Elastic on a Windows client and a web client on the K3s server. The completed build instead used two separate Ubuntu hosts: one for Rancher and one for the Elastic services. That change kept the management and data platforms outside the four machines carrying the application workloads.
Forming and managing the K3s cluster
I installed Docker on the four cluster VMs, configured the first as the K3s server and joined the remaining three as agents. K3s suited the lab’s limited compute and memory while still exposing the Kubernetes objects needed for the exercise: nodes, pods, deployments, services, ingress and namespaces.
Joining an agent required the K3s server endpoint and a shared node token. That token is a credential, so its value and the exact bootstrap commands are intentionally excluded from this public account.
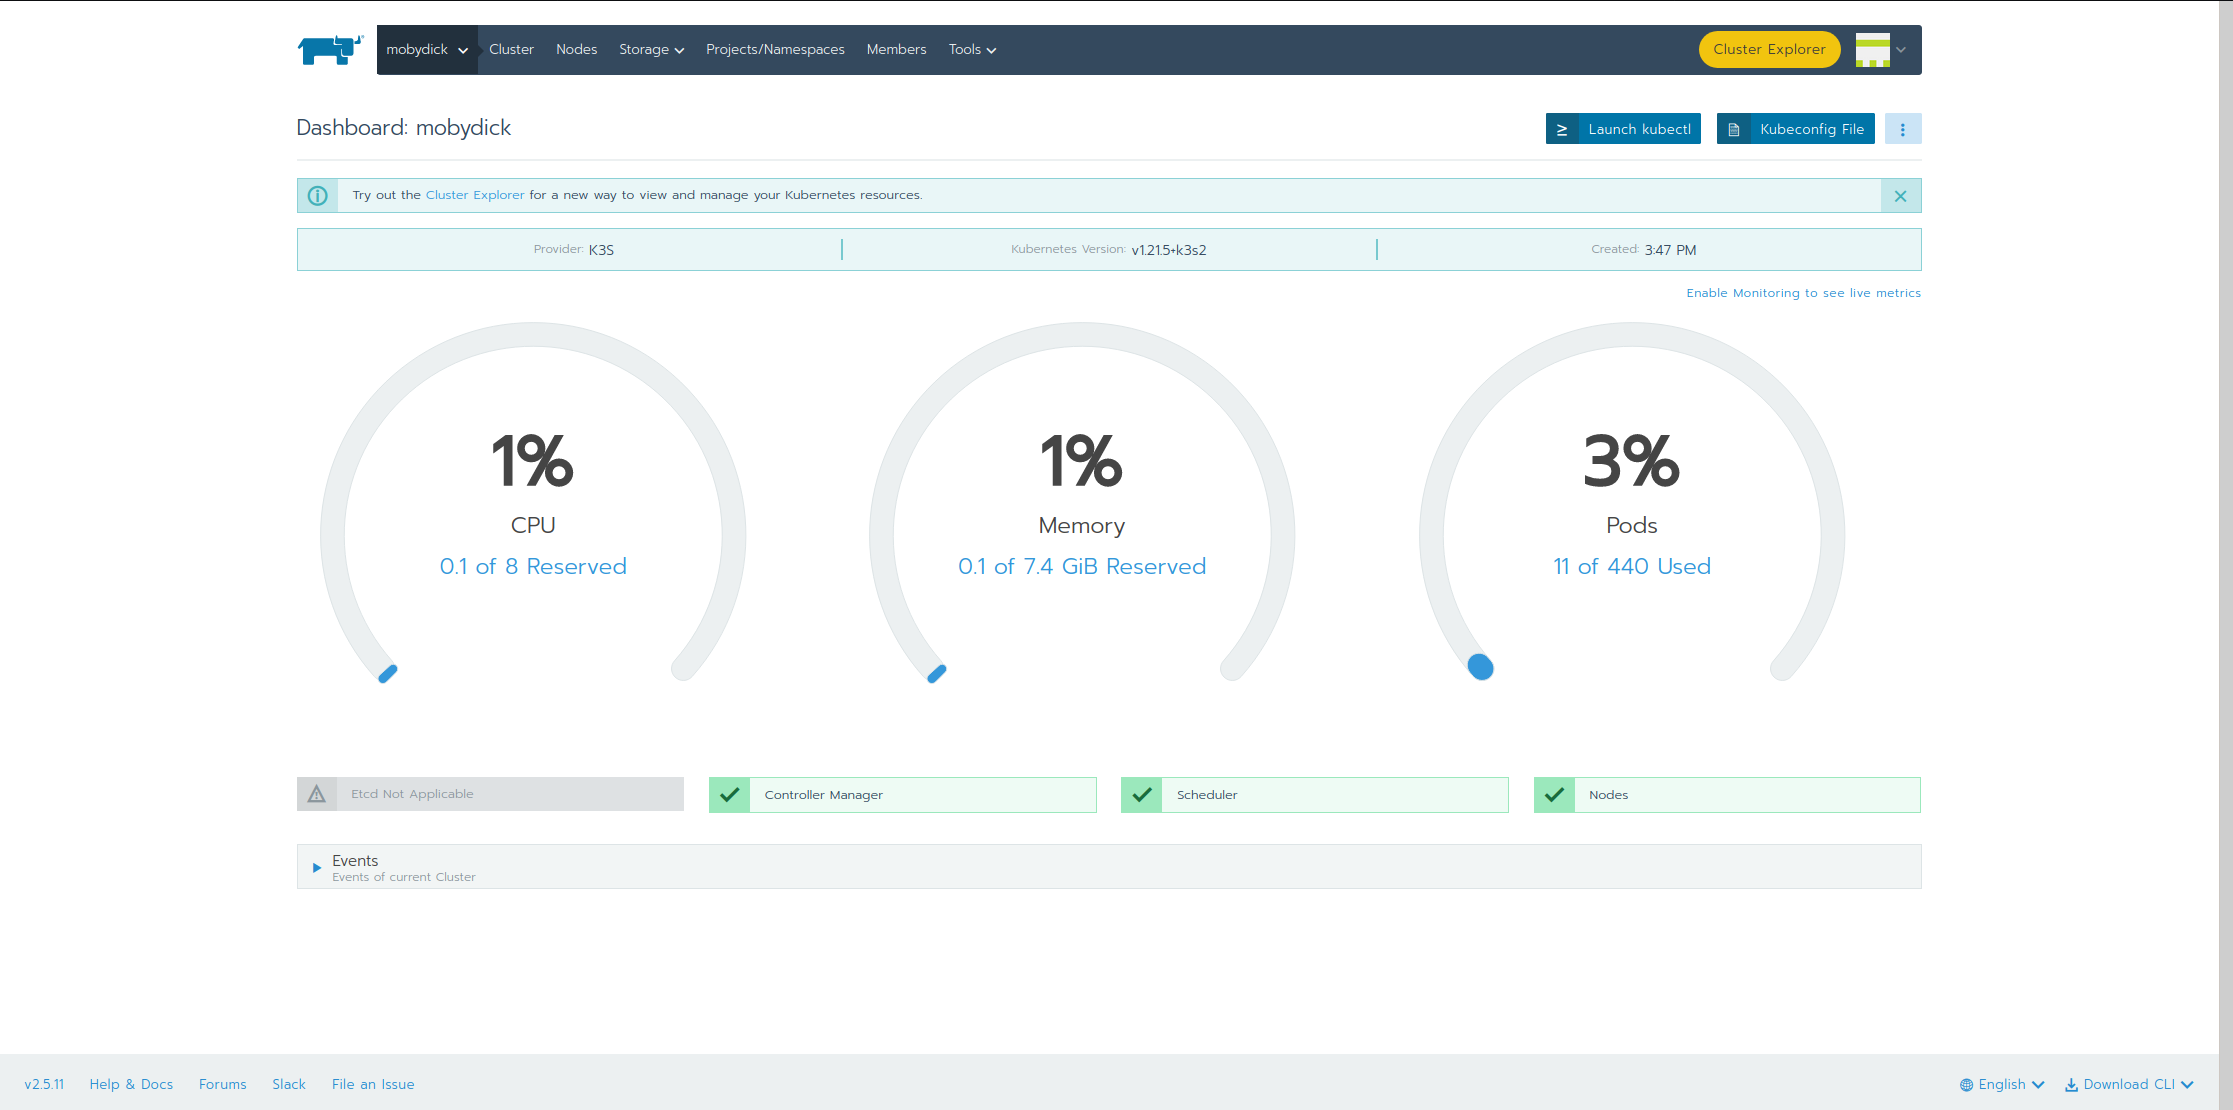
Rancher ran on the fifth VM rather than on a workload node. Its installation created a separate single-node management cluster, after which I imported the K3s environment as an external cluster. Rancher listed K3s version v1.21.5+k3s2, four active nodes and a separate local management cluster.
Rancher exposed the same resources through a web management surface: workloads, services, ingress, namespaces, environment variables, logs and container shells. That was useful for the exercise, but it also made Rancher a sensitive control point. An account permitted to change workloads or open a shell could materially alter what ran in the cluster.
Three workload patterns
The workloads were useful because each exercised a different relationship between a pod, its configuration, its state and the route used by a client.
Replicated service behind ingress
I deployed monachus/rancher-demo as three pods in the default namespace. A ClusterIP service exposed port 8080 inside the cluster, but the running pods were not yet reachable from the browser. I added an ingress with an automatically generated sslip.io hostname and targeted the service on port 8080.
I loaded the demonstration page at two different points. Its current-back-end identifier changed between replicas while the request count increased from 69 to 135 with no displayed errors. Requests therefore passed through the ingress to different back-end pods, but I did not measure distribution, load or pod-failure recovery.
The same workload also accepted a COW_COLOR environment variable through Rancher. This showed how declared runtime configuration could change the application’s presentation without rebuilding its image.
Bind-mounted Minecraft service
I deployed the Minecraft workload with itzg/minecraft-server, a single pod, host port 25565, EULA=TRUE and a bind mount from the node path data to /minecraft-data. Rancher recorded the pod running on one agent, and I then connected a Minecraft 1.18.1 client to that node and entered the hosted world.
This validated direct host-port reachability. I did not restart, replace or reschedule the pod and then check its data, so durable Kubernetes storage was not tested. The bind mount kept state outside the container’s writable layer, but also coupled the workload to node-local storage and its permissions, availability and backup arrangements.
Apache on an alternate host port
I deployed the Apache workload with httpd:latest, one pod and a namespace named httpd-webserver. I published container port 80 as host port 8001. My first request without the alternate port did not reach Apache; a request to the hosting node on :8001 returned the default “It works!” page.
I originally attributed the port choice to creating another namespace. That explanation conflated resource organisation with network binding. The namespace separated the Apache API objects from the earlier workload, while choosing host port 8001 avoided a node-level port collision.
I then used Rancher’s execute-shell option to modify the running container. That demonstrated administrative access, but not a repeatable deployment method. An interactive change could disappear with the pod; a maintainable version would place configuration in a versioned image or a controlled mounted resource and pin the image instead of using latest.
Building the Elastic side
I used the sixth VM to host Elasticsearch 7.15.2, Kibana, Logstash, Filebeat, Metricbeat and Nginx. An HTTP request to Elasticsearch returned node node-1, cluster ELK and version 7.15.2. I then reached Kibana directly on port 5601.

I configured more than one possible data path. Filebeat and Metricbeat on the Elastic host used direct Elasticsearch output and a Kibana endpoint for setup. The Kubernetes Metricbeat manifest also pointed at the external Elasticsearch service. Separately, I configured a Logstash Beats input and an Elasticsearch output:
Elastic-host Filebeat / Metricbeat -----> Elasticsearch :9200 -----> Kibana
K3s Metricbeat manifest ----------------> Elasticsearch :9200 -----> Kibana
Configured Beats input -----------------> Logstash ----------------> Elasticsearch
I cannot claim that Filebeat and Metricbeat used Logstash in the demonstrated pipeline. Their configured outputs point directly to Elasticsearch, and the populated indices do not identify Logstash as their transport. I configured the Logstash route separately while directly observing Beats-to-Elasticsearch ingestion.
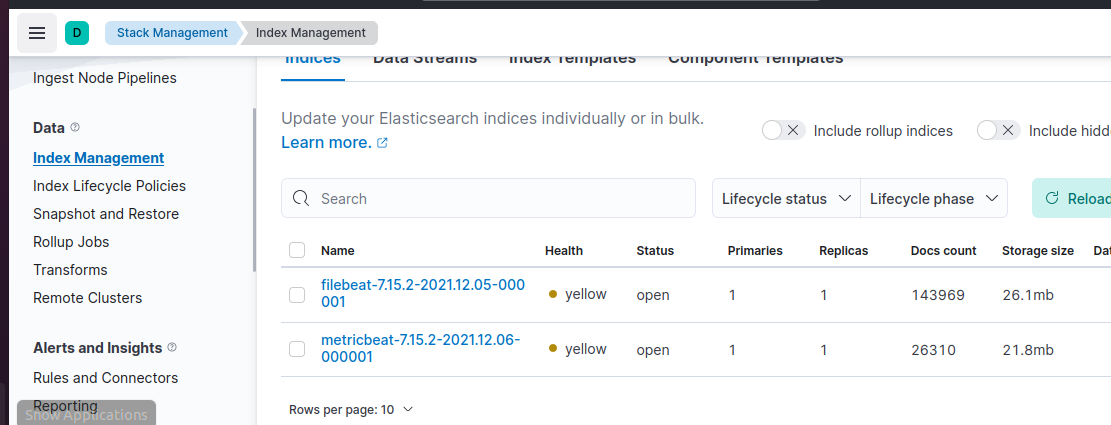
Kibana’s index-management view showed open Filebeat and Metricbeat indices containing 143,969 and 26,310 documents respectively. I also displayed a collected record containing the retired address of the K3s server, connecting the cluster-side Metricbeat configuration to data visible in Kibana.
I configured Nginx to place HTTP basic authentication in front of Kibana and recorded a successful nginx -t syntax check. I did not complete a browser test through that authenticated route, so only the Nginx syntax was validated. The direct Kibana check showed that Kibana itself answered.
Validation and results
The tests addressed different layers rather than treating a green dashboard as proof that the complete system worked:
| Check | Recorded result | Validation limit |
|---|---|---|
| Cluster registration | Rancher listed one active K3s cluster with four nodes and healthy controller-manager, scheduler and node checks | Supports joined agents and successful import, not node-loss recovery or control-plane high availability |
| Replicated ingress | Three demo pods were configured; browser captures showed different current back ends as requests increased | Supports routing to more than one replica, not even distribution, sustained load or failure recovery |
| Host-port workloads | A Minecraft client loaded the hosted world; Apache returned its default page on :8001 |
Supports both node-address service paths, not storage survival, failover or production-grade exposure |
| Elastic services | Elasticsearch returned its node, cluster and version; Kibana’s home page loaded | Supports direct service reachability, not successful Nginx authentication or encrypted shipper transport |
| Data collection | Kibana showed populated Filebeat and Metricbeat indices and a later record associated with the K3s server address | Supports ingestion and Kibana visibility, not complete coverage, alerting or use of Logstash by every event |
This layering was the main engineering lesson from the build. A running daemon does not prove that its client can reach it. A running pod does not prove that its service or ingress works. A configured bind mount does not prove recovery after replacement. A populated index proves ingestion, but not the precise path, completeness or usefulness of every event.
Security and operational limits
The coursework prioritised assembling and observing the platform. Several choices should remain confined to that dismantled lab: shared bootstrap material in the configuration notes, a self-signed certificate the browser did not trust, broad same-subnet connectivity, direct HTTP Elastic endpoints, node host ports, an interactive root shell, a node-local bind mount and unpinned public images.
Credential values are omitted from this public account. Four priorities stand out for a longer-lived rebuild: rotate and manage cluster credentials; establish certificate trust and encrypt shipper traffic; replace node-coupled host ports and bind mounts with controlled service exposure and storage; and pin and scan images while restricting administrative access. Retention and alerting would also need defined operational requirements before the platform could be described as production observability.
The observability platform would need the same protection as the workloads it inspected. Indices can contain usernames, command lines, host details and application data. An Nginx password prompt, even if validated, would not by itself provide per-index authorisation, protected service-to-service transport, auditability or a retention policy.
Historical boundary
This is a record of 2021 team coursework, not a current installation guide. The captured environment used Ubuntu Server 18.04, K3s v1.21.5+k3s2, a Rancher management cluster reporting v1.20.7+rke2r2, and Elasticsearch 7.15.2. The environment has since been dismantled; its private addresses and internal names are retired and are not used by a live or reused system. Any rebuild would need current Kubernetes, Rancher and Elastic documentation to verify supported installation methods, configuration keys, runtimes and security controls.
What remains valuable is the validation discipline I developed through the lab: separate management from workloads, define the route from a client to a pod, treat state as an explicit design problem, validate each layer independently, and distinguish a configured path from one supported by observed data.